Research background
Traditional rigid optoelectronic systems need adaptation for current food quality monitoring. This work presents a flexible wearable optical wireless sensing system (FWOS) fabricated by laser patterning PET/PI/Cu films as the substrate. The FWOS can be configured with different sensor arrays to fit fruits of various sizes. It acquires fruit spectral data and transmits them via Bluetooth (BT) to a smartphone or PC. Simulation was used to determine suitable laser power and scan speed, and a microscope measured the surface characteristics of the flexible Cu circuit. FWOS features simple fabrication, low cost, low power consumption, real-time monitoring capability, and small physical size. FWOS was used to estimate the soluble solid content (SSC) of apples, grapes, peaches, and cherries. Results indicate potential applications of FWOS across fruit quality monitoring, which could reduce food waste and support quality and safety assurance.
Key innovations
Xiao Xinqing's group at China Agricultural University proposed a near-infrared flexible wearable optical wireless sensing method for fruit quality monitoring. FWOS can be directly worn on most fruits and wirelessly transmit data. Multiple linear regression (MLR) and support vector machine (SVM) models were used to evaluate FWOS accuracy for SSC monitoring. Notably, the system produced promising results for grapes and cherries. Compared with prior conventional sensor monitoring in the authors' laboratory, FWOS addresses issues related to fixed sensor positions and manual handling. The sensor array also overcomes the limitation of single-point measurement. The device causes minimal damage to fruit and enables nondestructive testing. The FWOS concept can integrate into Internet of Things (IoT) deployments for fruit growth, cold-chain transport, storage, and retail, enabling remote monitoring without opening cold rooms or food packaging. The reported system cost is about $40, which could allow large-scale deployment of wearable sensors to collect larger datasets and improve maturity prediction accuracy.
Article analysis
Figure 1 illustrates the FWOS design. The flexible optical sensor array consists of PU adhesive tape, PET film, PI film, Cu circuit, PDMS film, and electronic components (Figure 1a). PET and PI films serve as substrates for the flexible Cu circuit; electronic components are soldered to the flexible Cu circuit; PDMS provides waterproofing and prevents oxidation of the Cu circuit. The PU medical tape is non-toxic, waterproof, and noncorrosive to the circuit. The optical measurement system layout is shown in Figure 1b. Structures of the flexible sensor array and a single flexible sensor are shown in Figures 1c–1d. The AS7263 is the core component used to measure fruit-reflected light. The AS7263 features ultra-low power consumption, compact size (4.5 x 4.7 x 2.5 mm), factory calibration, a wide operating temperature range (-40 to +85 C), and an integrated interference filter deposited directly on CMOS silicon. The AS7263 has two programmable LED drivers and two selectable interfaces (UART and I2C). A 2700 K LED provides illumination suitable for the AS7263 monitoring range. Flash stores the program controlling the AS7263. A Bluno module receives command code, processes sensor data, and transmits data via BT 4.0 to a smartphone or PC for further processing. Because identical optical sensors share the same I2C address, an I2C multiplexer is required to receive data from multiple sensors simultaneously. The optical sensor array is highly flexible (Figures 1e–1g). A Bluetooth-enabled device can obtain real-time wireless updates on fruit quality changes (Figure 1f).
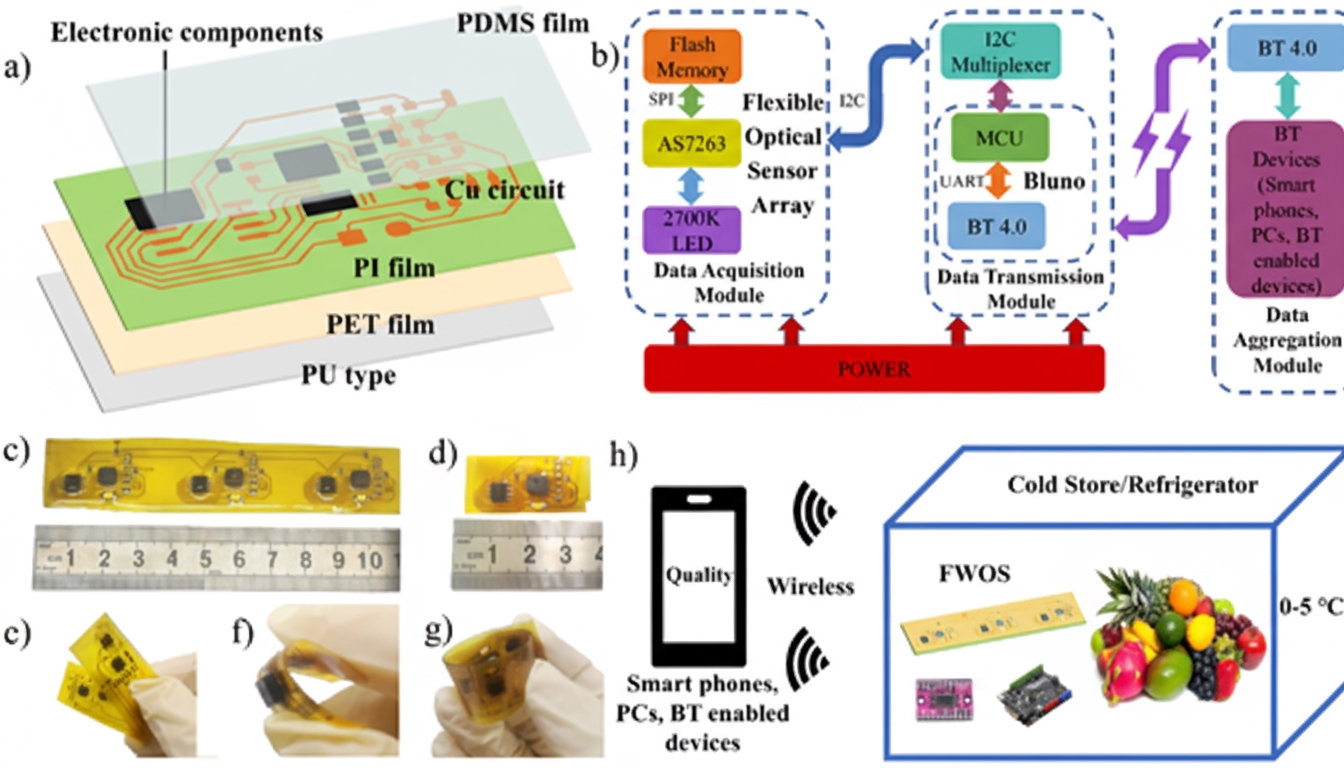
Figure 2 describes flexible circuit fabrication. The ultraviolet laser marking system includes a PC, a UV nanosecond laser, an industrial chiller, and a galvanometer (Figure 2a). The industrial chiller cools the UV nanosecond laser during operation. The laser wavelength is 355 nm and the pulse width is about 15 nm. After cleaning and drying, the unablated film is fixed onto an Al substrate. The designed circuit pattern is imported into the laser ablation software on the PC. When the laser acts on the Cu film, Cu is rapidly removed by sublimation. Two ablation passes on PET/PI/Cu film produce the flexible Cu circuit (Figure 2b). After cleaning and drying, the flexible circuit is obtained (Figures 2c–2d). After two ablation passes, the Cu surface loses conductivity and exhibits good flexibility (Figures 2e–2h).
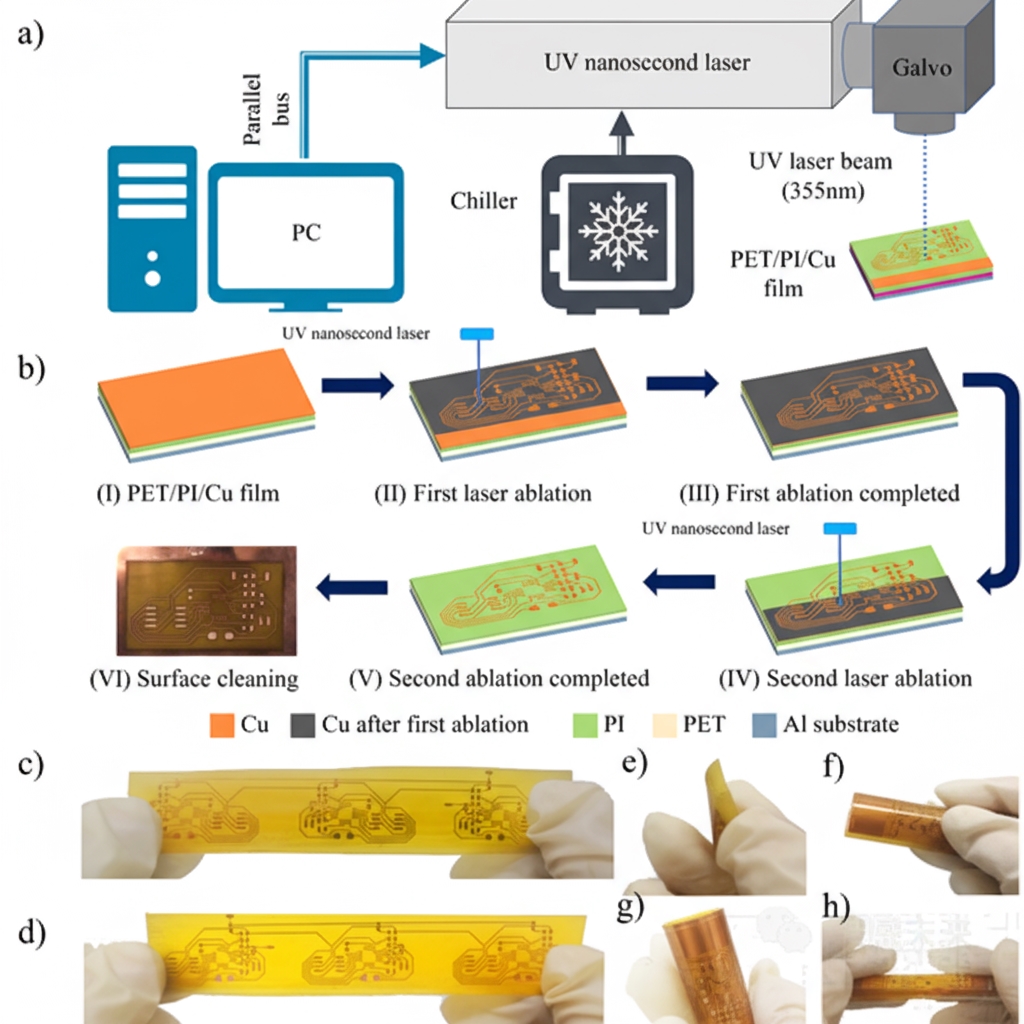
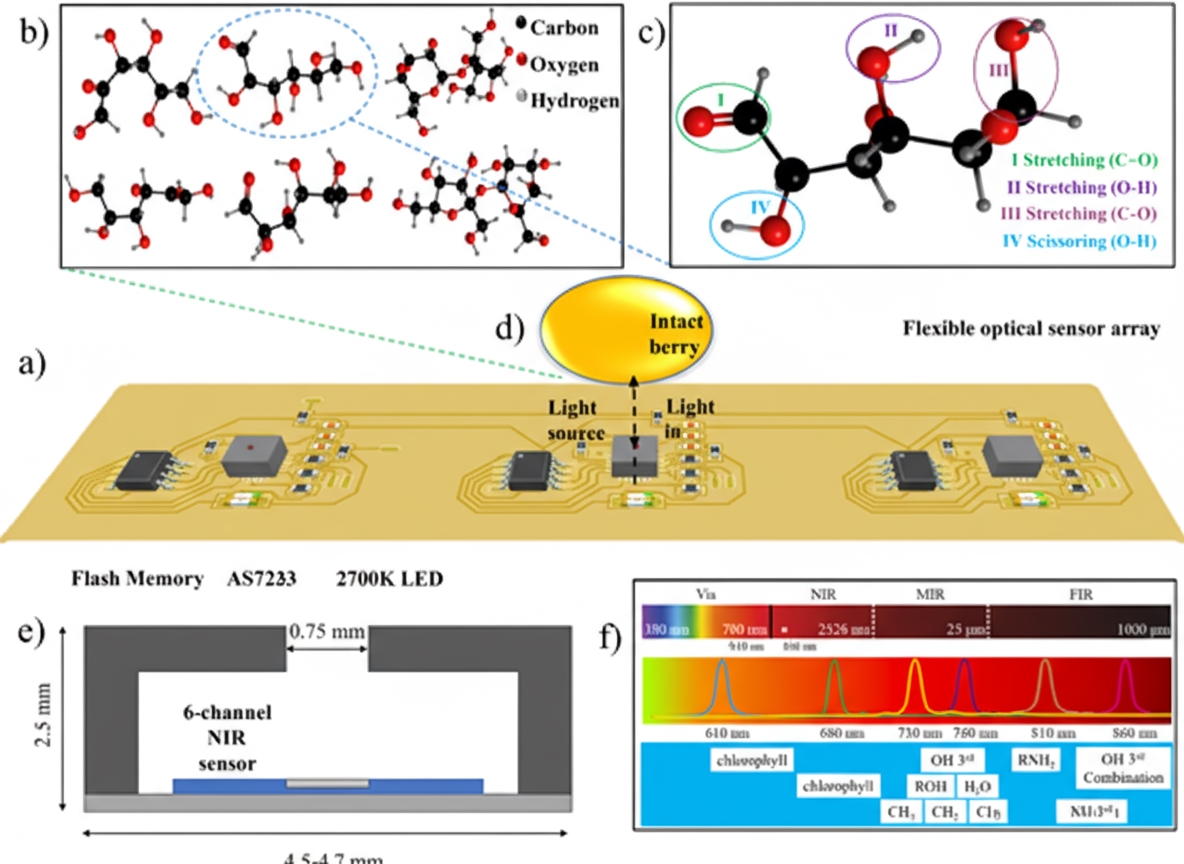
Figure 4 presents the principle of measuring fruit quality with the flexible sensor array. The flexible sensor array wraps around the fruit; light from the LED illuminates the fruit surface and enters the AS7263 via diffuse reflection (Figures 4a, 4d, 4e). Near-infrared (NIR) lies between visible light (Vis, 380–780 nm) and the mid-infrared (MIR, 2526 nm to 25 um) and far-infrared (FIR, 25–1000 um). Almost all organic structures and functional groups can be measured in the NIR spectrum, which yields relatively stable spectra. NIR measurement relies on anharmonicity of atoms or molecules that leads to changes in absorption during vibrational transitions (Figures 4b and 4c). When molecules or atoms vibrate, they stretch, shear, oscillate, and bend; these anharmonic motions produce overtone and combination absorptions that create distinct spectral features. The NIR region captures absorption information from key chemical bonds such as C-O, C=O, O-H, and H2O, which reflect internal fruit quality. The AS7263 provides six NIR sensing channels (610 nm, 680 nm, 730 nm, 760 nm, 810 nm, and 860 nm, each with a 20 nm full-width at half-maximum, as shown in Figure 4f). Channel averages are used as the final berry spectral values. Peaks at 630 and 690 nm correspond to chlorophyll, 730 nm corresponds to the third overtone of O-H stretching, and 810 and 860 nm correspond to combination bands of sugar O-H groups.
For the SSC parameter, the standard deviation is about 20% of the range between parameter maximum and minimum, indicating meaningful calibration. Each fruit dataset covers a wide and differing range, showing interfruit variability. Measurement procedures and results for different fruits are shown in Figure 5. Figures 5a and 5b show single-sensor measurements (grapes and cherries). Figures 5c and 5d show sensor array measurements (apples and peaches). The array method saves time but requires enough fruit surface area to place multiple sensors, so apples and peaches were measured with the array. When the flexible optical sensor array is attached to the fruit surface, the impact on the fruit is minimal, and data stabilize after about two seconds. Appropriate preprocessing can improve model prediction accuracy to some extent, but improper preprocessing can reduce accuracy. Grape predictions were best and peach predictions were worst, possibly related to their absorbance (Figure 5e). Figures 5f–5i show the best SSC prediction models for the four fruits. RPD values for peaches, apples, and cherries are about 1.5, indicating FWOS can distinguish high and low SSC values. The grape model has an RPD near 2, indicating a single-sensor optical system can roughly separate grape SSC levels. In classification models, grapes achieved a 73.1% success rate and cherries 80%.

 ALLPCB


